
My Data Science Workflow
One of my friends asked me what my data science workflow is when I start a new data project. I’ll breakdown my workflow and tools here:
-
Ask an interesting question. Typically I will see something and ask “why does that happen?”
-
Find data that is relevant. This is one of the more difficult aspects to a data project. I will search for datasets at sites like /r/datasets (general data), data.gov, AWS Public Data Sets, or Quandl (financial data). More obscure data requires good old google searching.
-
Download the data. Data comes in many forms such as .csv, .json so you need to download it to your directory where you will be performing the analysis.If you are lucky, sometimes the site has an API you can query the data with and pull it straight into python.
-
Load the data into your program. I use the SciPy stack for Python and use Jupyter Notebooks for the analysis. Pandas loads data into a DataFrame which is essentially an Excel sheet where you interact with the data through python code.The easiest way to get the full stack is to download Anaconda.
-
Clean the data. Your first steps will be to see if the data has been cleaned. If it hasn’t you will have to clean it yourself. There is popular saying out there that says 80% of a data scientist’s job is cleaning data and there is validity to that statement. You need to ensure each column of data is the same data type, confirm data ranges are correct, find NaN’s or NULLs, and check for anomalies. Some these are simple where you can scan a column for a data type, while others are discovered by using statistical methods such as means, maxs, or mins. A great helper function I use is Pandas Profiling
-
Perform Exploratory Data Analysis. This step overlaps with data cleaning. Your goal is maximize your insight into the dataset. My go to source is the NIST Engineering Statistics Handbook for how to perform. I use seaborn for visualizations.
6.1 Univariate distributions - histograms
6.2 Multivariate - Scatterplots or pair plots
6.3 Categorical data - use strip plots, box plots or bar plots
-
Ask your self “Will the data allow me to answer my question?”. If no, then repeat from 2. A lot of times you will be pulling from multiple data sources and have to merge the data in step 5.
-
If it is comparing one mean to another, then proceed with 8.1. If you are working with a more complicated data set or would like to model it, proceed to 9.
8.1. If I’m comparing one data set to another where they differ by one level to see if there is a “statistically significant difference” or rejecting the null then I will typically t-test it. If it is multiple treatments or levels (where I have changed one variable to test the output) then I like to use an ANOVA. I use StatModels for simple statistics and modeling.
-
If I’m trying to model the data to predict an outcome, I move to scikit-learn.
9.1. Preprocess that data! At this stage I break the data up into a cross validation (CV) sets and a test set. This is vital to prevent over-fitting of your model. I use k-folds Cross Validation from scikit-learn to perform this function.
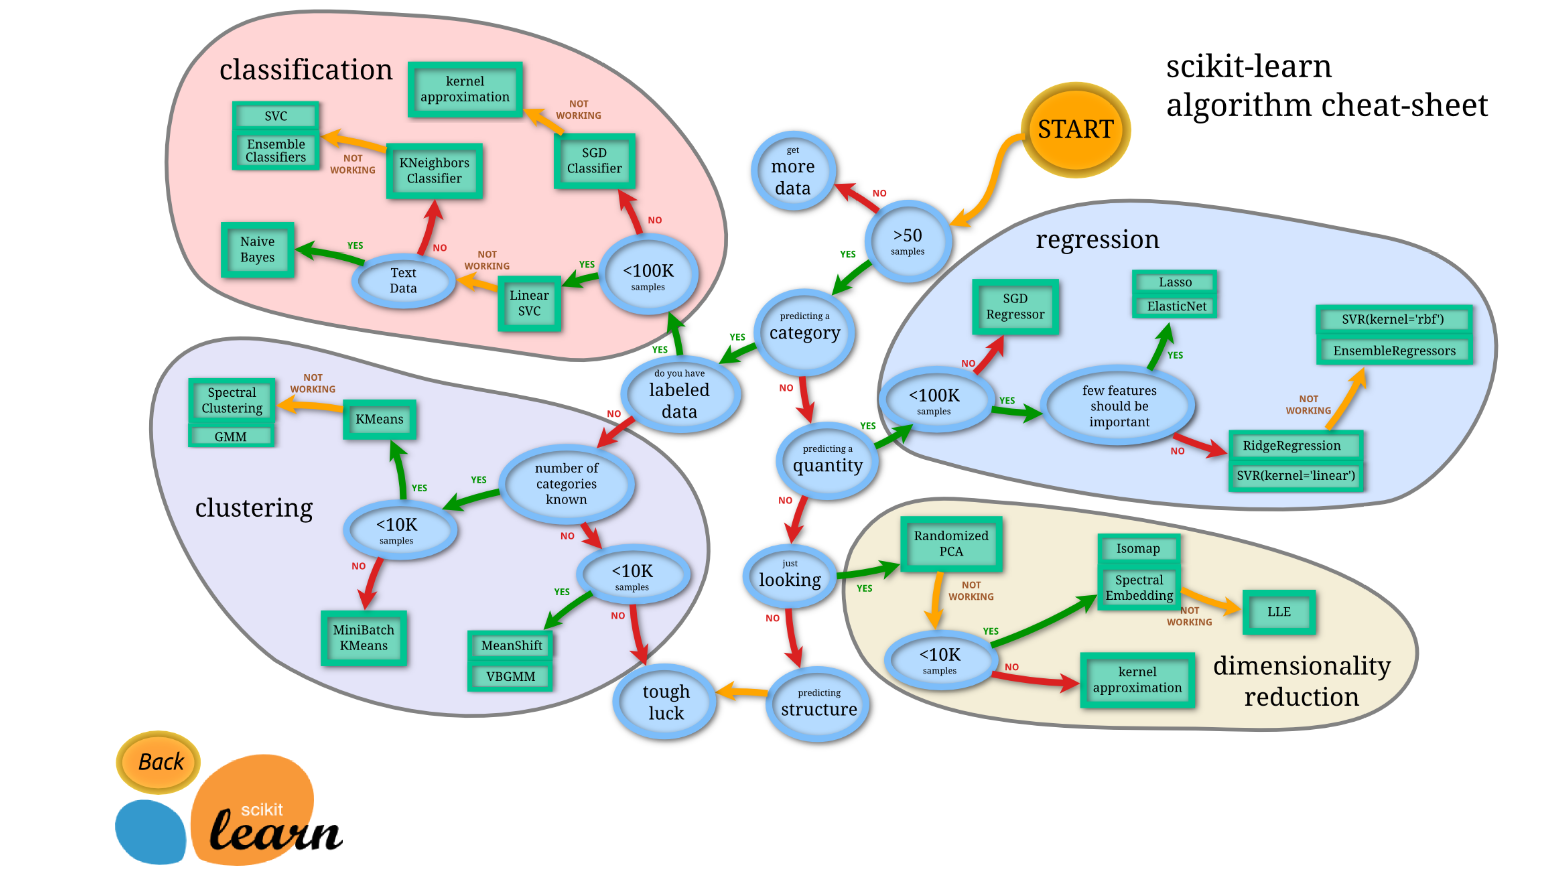
9.2. Time to figure out which model to use. I almost always check out this flow chart from scikit-learn to help decided which model to use:
9.3. After a first pass of the model, you need to check for which features have the largest impact. In a linear model these are your parameters. Large values indicate a greater effect on the model. Smaller values could potentially be dropped. This helps reduce the complexity of your model and decrease the processing power needed. Additionally, it helps reduce the chance of over-fitting the data. At this point you need to balance the model bias and variance.
9.4. If you have a model now that fits your CV sets well, test it on the test set. If it tests well (typically >80% accuracy), congrats you have produced a good model. Be careful if you have a model with greater than 95% accuracy. THis could be a sign your model is over-fitting the data.
-
Report your findings!